A bull market is a financial market characterized by rising asset prices, optimism among investors, and a generally positive economic outlook. In a bull market, the overall sentiment is bullish, and there is a widespread expectation that prices of various financial instruments (such as stocks, bonds, commodities, and real estate) will continue to increase.
Key features of a bull market include:
Rising Prices: The prices of assets, particularly stocks, tend to trend upward over an extended period. This positive trend often leads to new record highs.
Investor Confidence: Investors and traders are generally optimistic about the future prospects of the market and tend to be more willing to buy and hold assets, anticipating further price gains.
Economic Growth: Bull markets are typically associated with periods of strong economic growth, low unemployment rates, and increasing corporate profits.
High Trading Volume: Bull markets often experience higher trading volumes as more investors participate in the market.
Positive Sentiment: Positive news and economic indicators dominate media headlines, reinforcing the optimistic sentiment.
Bull markets can last for varying periods, ranging from several months to several years. However, they are not perpetual, and eventually, they may be followed by a bear market, which is characterized by falling asset prices and a pessimistic outlook.
A bear market is a financial market characterized by falling asset prices, pessimism among investors, and a generally negative economic outlook. In a bear market, the overall sentiment is bearish, and there is a widespread expectation that prices of various financial instruments (such as stocks, bonds, commodities, and real estate) will continue to decline.
Key features of a bear market include:
Falling Prices: The prices of assets, particularly stocks, tend to trend downward over an extended period. This negative trend often leads to significant losses and declines from previous highs.
Investor Caution: Investors and traders become cautious about the market’s future prospects and may choose to sell assets to limit losses or move to safer investments.
Economic Slowdown: Bear markets are often associated with periods of economic slowdown or recession, leading to reduced consumer spending and declining corporate profits.
Low Trading Volume: Bear markets can experience lower trading volumes as investors become more risk-averse and refrain from active trading.
Negative Sentiment: Negative news and economic indicators dominate media headlines, reinforcing the pessimistic sentiment.
Bear markets can also vary in duration, lasting for several months to several years. However, they are not perpetual, and eventually, they may be followed by a return to a bull market, characterized by rising asset prices and a more positive outlook.
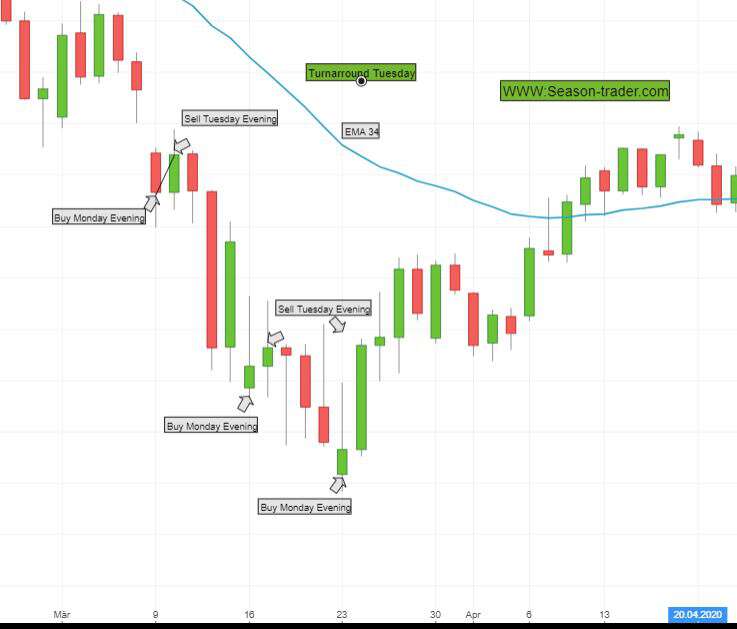
The effect in the stockmarket is known as the Turnaround Tuesday, therefore traders can shop at a bear market on Monday evening.
The market fluctuates constantly. For most traders what happens on the stock market every day is unstable and unpredictable. Human psychology has been the same for thousands of years. In some cases we are fearful and when the situation worsens we will panic. Today’s stock market is the same, when prices fall and collapse, investors panic and sell stocks.
The Turnaround Tuesday strategy focuses on this fear of loss. Clever traders can thus gain a statistical advantage that takes advantage of the ignorance and emotional fear and helplessness of the operational market participants. This strategy works optimally in falling stock markets and particularly well in crash situations, i.e. when the fear of losses is greatest and many investors find it difficult to keep a cool head.
To benefit from the strategy, the stock market (S&P, EuroStoxx 50 or DAX) must be in a bear market. Back tests have shown that this is best checked using a moving average.
– A moving average (SMA or EMA) below the 34 day line – bear market
– A moving average (SMA or EMA) above the 34 day line – bull market
Similar results are also found for moving averages between 30 and 40.
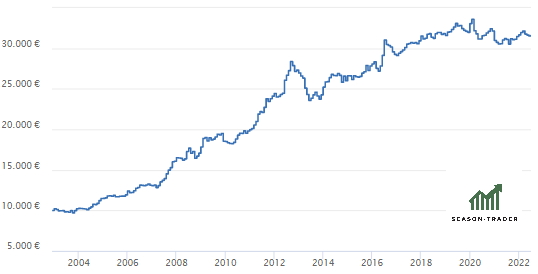
The equity curve shows the impressive return on investment this strategy!
Season Trader subscribers receive the concrete entry & exit suggestions via Telegram on the mobile phone, tablet or workstation PC.
This is one of 8 profitable trading strategies you can get via Telegram.
The easiest way is to implement the trading signals as recommended. Signals from season traders give you a clear statistical advantage on the stock market. How you use it, of course, we leave it up to you. You can do this with a Minifuture, CFD’s or a leveraged ETF.
Alternatively, experienced traders can optimally implement Turnaround Tuesday by selling put options, as volatility should decrease.


